


 Inlägg


Monckton presents the following graph which is a translation of another graph by Swedish professor Gösta Pettersson. The graph is supposed to show the amount of 14C added to the atmosphere by nuclear bomb tests in the 1960's, and how that amount has declined since the bomb tests were halted. It also shows how a spike of CO2 is absorbed by other carbon reservoirs according to the Bern model, a model of the carbon cycle. Notice that the 14C declines much faster. This is supposed to prove that the Bern model is wrong: it seems to give a residence time for CO2 that is far too long. As a consequence, CO2 from fossil fuels must be absorbed much faster than previously thought, and therefore the increase of CO2 must be mainly due to natural processes instead. That is how the argument goes. Unfortunately, it is wrong.

Δ14C = ([14C/12C]sample / [14C/12C]standardsample – 1) x 1000
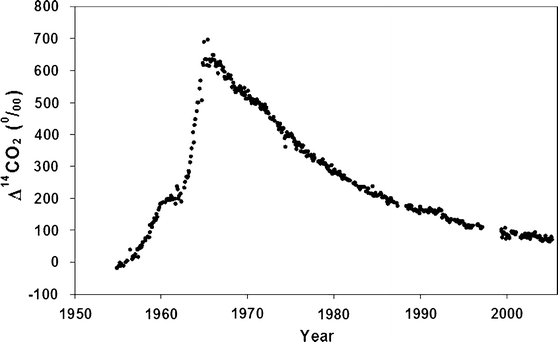
Fossil fuels have added a considerable amount of 12C but no 14C, which has resulted in a decrease of the 14C/12C ratio. What we see in the bomb test curve is the combination of absorption of bomb test 14C by other reservoirs and the dilution of atmospheric 12C and 14C with 12C from fossil fuels. On top of that comes 14C generation by cosmic rays.
The following graphs show a bomb test curve measured at Wellington, NZ, in terms of Δ14C (top) and in terms of absolute amounts (bottom). As one can notice, the latter curve resembles the Bern model curve above much more closely. As a massive spike of CO2 and a much smaller spike of 14CO2 during a period of a gradual increase of CO2 are not the same thing, we don't expect a perfect match, though.

Eventually, Gösta Pettersson admitted his mistake. However, it has now taken a life of its own in the deniosphere, and is likely to keep circulating for quite a while. Mistakes usually have a long residency time in climate denial blogs like WUWT.
Source of NZ bomb test curves: Kim I. Currie, Gordon Brailsford, Sylvia Nichol, Antony Gomez, Rodger Sparks, Keith R. Lassey and Katja Riedel. Tropospheric 14CO2 at Wellington, New Zealand: the world’s longest record, Biogeochemistry 2009, 10.1007/s10533-009-9352-6


